LinkedIn Analytics for Post Optimization

LinkedIn Analytics helps you understand how your content performs, so you can refine your strategy and reach the right audience. By tracking metrics like engagement, impressions, and audience demographics, you can identify what works best and grow your presence. Key takeaways include:
- Engagement Metrics: Reactions, comments, shares, and clicks show how users interact with your posts. A high engagement rate signals strong content.
- Impressions vs. Reach: Impressions show how often your post is seen, while reach tracks unique viewers. Balance both for better visibility.
- Audience Demographics: Insights like job titles, industries, and locations help tailor content to your audience.
- Content Formats: Video posts and polls generally outperform text-only updates. Short videos under 30 seconds are especially effective.
- Posting Times: Tuesdays and Thursdays at 10:00–11:00 a.m. are peak times for engagement. Adjust based on your audience’s activity.
- Frequency: Posting 2–5 times weekly increases impressions and engagement.
Tools like Typoro simplify tracking and provide actionable recommendations based on your analytics, saving time while boosting results.
10 WAYS to Optimise Content (LinkedIn Content Help)
Key Metrics to Track for Post Performance
LinkedIn provides several metrics to help you understand how your posts are performing and who’s engaging with them. These insights are essential for fine-tuning your content strategy and ensuring it resonates with your audience.
Engagement Metrics
Metrics like reactions, comments, shares, clicks, saves, and sends measure how actively people are interacting with your content. LinkedIn offers six distinct reaction types – Celebrate, Support, Funny, Love, Insightful, and Curious – that go beyond a simple "like" to convey more specific emotional or intellectual responses. Comments, in particular, reveal which topics spark genuine conversations. For instance, if a post gets plenty of likes but few comments, it might indicate that while the content is agreeable, it’s not sparking deeper engagement.
Shares (or reposts) are especially powerful, as they extend your content’s reach to the sharer’s network. This not only increases visibility but also signals that your content is worth advocating for. As SocialPilot puts it:
A share means someone believes your content is worth showing to their network. Track shared posts closely; they tell you what’s truly valuable or resonant.
Clicks show curiosity, saves highlight perceived value, and sends indicate private sharing, all of which provide insight into how your content is being received.
Personal branding expert Nicole Sifers demonstrated the impact of engagement by achieving over 1 million impressions on a single LinkedIn post. Her strategy? A compelling hook, a clear narrative, and a direct call-to-action. To measure engagement, divide total interactions (reactions, comments, clicks, shares, etc.) by total impressions. For context, LinkedIn’s average engagement rate is around 2.11% as of May 2025.
Once you’ve gauged engagement, the next step is to assess how far your content is reaching by tracking impressions and reach.
Impressions and Reach
Impressions measure how often your post appears on users’ screens, while reach (or "Members Reached") reflects the number of unique individuals who saw it. A high ratio of impressions to reach suggests your content is being viewed multiple times by the same users, which could indicate strong interest or repeated exposure.
When your posts generate high engagement, LinkedIn’s algorithm rewards this by showing the content to a broader audience, including non-followers. On the flip side, if your reach is high but engagement remains low, it might be time to rethink your hook or visuals to better capture attention. To evaluate your content’s impact, compare likes to impressions. Regularly monitoring these metrics – weekly, for example – can help you adjust your strategy when impressions start to rise or level off.
Audience Demographics
Beyond engagement and reach, audience demographics offer a deeper look into who is interacting with your posts. LinkedIn’s analytics provide data about your viewers’ job titles, industries, locations, seniority levels, and company sizes. Considering that 96% of B2B content marketers use LinkedIn for organic marketing, these insights are invaluable for reaching the right professional audience.
For example, if your analytics show a high percentage of C-suite followers, you might pivot from entry-level content to more strategic, thought leadership pieces. If one industry – like HR – dominates your audience, you could focus on themes relevant to that field, such as workplace culture or recruitment trends. Location data can also guide you in creating region-specific content or adjusting your posting schedule to align with different time zones. Lastly, tailoring your messaging to company size – like addressing "resource optimization" for small businesses versus "enterprise digital transformation" for larger organizations – can make your content even more effective.
How to Optimize Content Formats Using Analytics
LinkedIn Content Format Performance: Engagement Rates and Reach Statistics 2025
Comparing Format Performance
LinkedIn analytics provide valuable insights into which content formats – like text, images, videos, polls, or carousels – resonate most with your audience. By analyzing performance metrics such as engagement rate (calculated as total interactions divided by impressions), you can pinpoint which formats are driving meaningful engagement, regardless of the size of your audience.
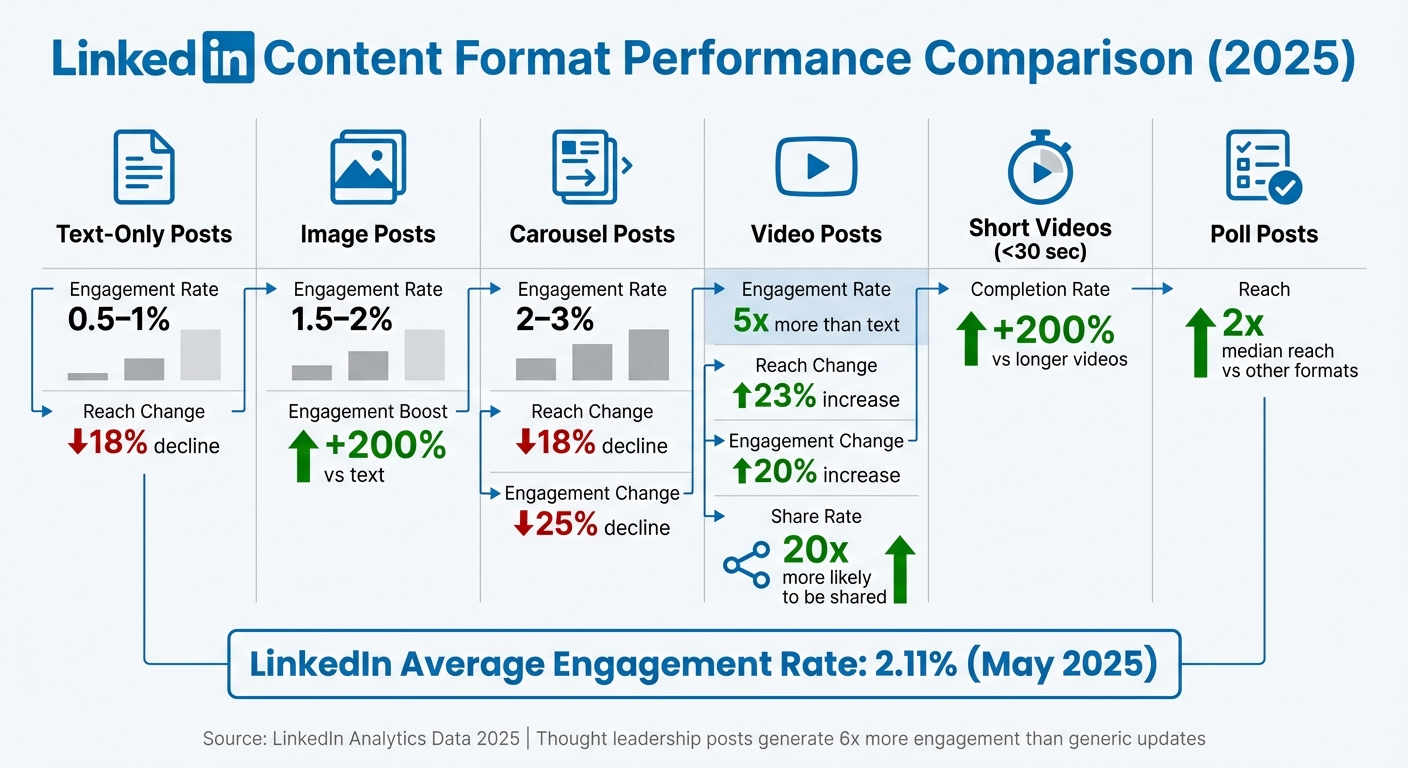
Recent trends highlight notable shifts in format effectiveness. For example, in 2025, native video posts saw a 23% increase in reach and a 20% boost in engagement, while text-only posts experienced an 18% decline in reach. Similarly, document carousels faced both an 18% drop in reach and a 25% decrease in engagement. These changes underline the importance of staying updated on format performance, especially since thought leadership posts generate six times more engagement than generic job-related updates.
Each format brings unique advantages. Polls, for instance, achieve nearly double the median reach of other post types, making them highly effective for reaching a larger audience. Videos are another standout, generating five times more engagement than text-only posts and being 20 times more likely to be shared. Meanwhile, posts with images drive 200% more engagement compared to plain text. Engagement rates vary widely across formats: text posts typically land between 0.5–1%, images range from 1.5–2%, and carousels often achieve 2–3%.
A practical example comes from Q2 2023, when HubSpot increased employee-generated content by 30% and video posts by 40%. This strategy led to a 7.8% engagement rate and a 145% spike in comments. Their success stemmed from focusing on formats that sparked meaningful interactions, tracked through metrics like the comment-to-reaction ratio.
Now, let’s dive into how native video and strong visuals can amplify these results.
Using Native Video and Visuals
Native video and visuals are powerful tools for boosting engagement. LinkedIn’s algorithm favors native video because it keeps users on the platform, leading to better reach and interaction rates. Uploading videos directly to LinkedIn, instead of linking to external sites, can significantly improve performance. For example, LinkedIn Live videos generate 24 times more interaction than standard posts.
Video length plays a critical role in engagement. Short videos under 30 seconds often perform best, with completion rates 200% higher than longer videos. HubSpot’s 15-second native tutorials are a great example – they increased watch time by 45% and drove a 28% uptick in product sign-ups. For more in-depth content, videos between 1–2 minutes work well, but keep quick tips and tutorials concise to maximize completion rates.
Beyond video, other types of visual content can also deliver strong results. In May 2025, creator Silja Engelstoft shared a simple, single-image post outlining a LinkedIn morning routine. Designed for quick consumption, the post generated 372 reactions and 126 comments, far outperforming typical text updates. Multi-image posts, featuring up to nine images, are also gaining traction by allowing creators to tell engaging stories across multiple frames.
To optimize video performance, monitor metrics like video views (tracked after two seconds of watch time) and time viewed to gauge the effectiveness of your opening hook. If impressions are high but view time is low, consider moving your call-to-action earlier or shortening the video. Additionally, track shares, as this metric indicates your content’s value and its ability to extend your organic reach.
sbb-itb-1b818d9
Finding the Best Times and Frequency to Post
Identifying Optimal Posting Times
Since LinkedIn Analytics doesn’t offer a built-in heat map, you’ll need to dig into engagement patterns to find when your audience is most active. Start by using the "Daily" toggle in the trend graph to spot performance spikes on specific days rather than relying on cumulative data. Then, cross-check your top-performing posts by impressions or engagements with your posting log to figure out the exact times your best posts went live.
Take a close look at your audience demographics – especially their locations – and align your posting schedule with their time zones. For instance, if most of your followers are in New York, posting at 10:00 a.m. EST can catch their mid-morning break. If your audience is in London, that same post should go live at 3:00 p.m. GMT to hit their afternoon browsing window. According to Buffer’s 2025 analysis of 1 million posts, 10:00 a.m. and 11:00 a.m. on Tuesdays and Thursdays are prime times for engagement, with Thursday standing out as the top day to post. Conversely, Sunday typically sees the least activity.
"Timing plays a role in visibility, but ensuring your content reaches the right audience is even more critical." – Alexandra Morales, Creative Communications & Content Leader, LinkedIn
Since LinkedIn only displays relative timestamps (like “3h” or “2d”), it’s a good idea to manually track exact posting times using a calendar or scheduling tool. Once you’ve identified general trends, experiment within the peak window of 7:00 a.m. to 4:00 p.m. on weekdays, then zero in on your specific “sweet spot” using your analytics. After nailing down your optimal times, you can fine-tune your posting frequency to maximize engagement.
Setting Your Post Frequency
How often you post can significantly influence both your total reach and per-post engagement. Research from Buffer shows that increasing your frequency from 1 post per week to 2–5 posts weekly adds an average of 1,182 impressions per post and boosts engagement by 0.23 percentage points. Upping your posts to 6–10 per week can result in 5,001 additional impressions per post and a 0.76 percentage point increase in engagement, while posting 11+ times weekly can deliver nearly 17,000 more impressions per post and a 1.4 percentage point jump in engagement rate.
"Moving from 1 post a week to 2 to 5 is like flipping a switch – LinkedIn starts distributing your content more widely and rewarding you with stronger per-post performance." – Tamilore Oladipo, Sr. Content Creator, Buffer
To scale effectively without sacrificing quality, keep an eye on your "Content" and "Followers" metrics in LinkedIn Analytics. Start with a manageable 2–5 posts per week to build momentum without overwhelming yourself, and scale up if you can maintain high-quality content. These strategies work across all account sizes, whether you have 500 followers or 50,000+. Track engagement metrics – like reactions, comments, and reposts – over time to identify trends and refine your approach. Adjust your posting schedule based on what you learn to keep your audience engaged and growing.
How Typoro Simplifies LinkedIn Analytics and Post Optimization
Keeping track of LinkedIn metrics across multiple posts can be a time-consuming task – something most founders can’t afford to spend hours on each week. Typoro streamlines this process by bringing all your key LinkedIn analytics – like impressions, engagement, audience demographics, and best posting times – into one easy-to-use dashboard. This setup makes performance tracking straightforward and efficient.
Tracking Performance with Typoro
Typoro provides founders with a clear game plan for turning profile views and content into tangible results, such as qualified leads, new hires, or investor interest. It automatically tracks key metrics like engagement rates, non-follower reach, and video completion rates to reveal trends that can help you fine-tune your approach. For instance, if your carousel posts consistently achieve a 2–3% engagement rate while your text posts hover at 0.5–1%, Typoro highlights this pattern, allowing you to focus on what works best. It also identifies how much of your content is reaching beyond your immediate network, with an ideal benchmark being 40–60% of your total reach coming from non-followers.
Typoro’s audience insights go a step further by breaking down follower demographics, including location, industry, and seniority. This helps you tailor your posting schedule to align with your audience’s time zones and interests. Plus, its AI-driven automation can cut the time spent on manual data collection by up to 80%. The platform even monitors the critical first 48 hours after publishing, when LinkedIn’s algorithm is most likely to boost your content, and alerts you to posts that could benefit from an extra push.
AI-Powered Content Recommendations
Typoro doesn’t just track metrics – it uses them to help you create better content. Its AI tools refine content recommendations to maximize engagement. For example, the AI Ghostwriter suggests post ideas and creative hooks based on your past performance. It analyzes which formats – like images, carousels, or videos – work best for your audience and adjusts future recommendations accordingly. Given that LinkedIn videos generate five times more engagement than text posts and short videos (under 30 seconds) see 200% higher completion rates, Typoro’s AI ensures your content grabs attention and drives results.
What’s more, the AI adapts to your unique voice, ensuring its suggestions feel natural and authentic. If your data shows that posts with over five comments get 2.5× more views, Typoro might nudge you to create content that sparks discussions. This shift from simply tracking metrics to using them for smarter content strategies allows you to grow your network and strengthen your thought leadership in a meaningful way.
Conclusion
LinkedIn analytics go far beyond being just numbers on a screen – they serve as a powerful guide to turning profile views into tangible opportunities. For busy founders, the key difference between guessing what works and knowing what works lies in tracking the right metrics and using that data to make smarter decisions. By understanding which content formats resonate, the best times to post, and the demographics of your audience, you can eliminate much of the guesswork.
Focusing on actionable insights instead of vanity metrics is what separates occasional posters from true thought leaders. High engagement not only signals to the LinkedIn algorithm that your content is worth sharing but also expands your reach beyond your immediate network, bringing in fresh eyes and potential connections.
For time-strapped founders, simplifying this process is essential. Tools like Typoro make it easier by consolidating analytics, automating performance tracking, and even offering AI-driven content suggestions based on proven trends. Instead of spending hours sifting through data, you can focus on building relationships and closing deals while the tool identifies patterns, suggests optimal posting times, and sharpens your content strategy. In short, leveraging the right tools turns overwhelming data into straightforward, actionable steps.
FAQs
How can I use LinkedIn Analytics to boost engagement on my posts?
To get the most out of your LinkedIn efforts, dive into LinkedIn Analytics to see what truly connects with your audience. Look at key metrics like impressions, engagements, and audience demographics for each post. These numbers can reveal trends – whether it’s the type of content, specific hashtags, or even the time of day your audience is most active.
Once you identify what’s working, double down on those strategies. At the same time, take a closer look at posts that didn’t perform well and make adjustments. Maybe it’s a matter of timing, the topics you’re covering, or how you’re targeting your audience. Regularly reviewing and refining your approach based on these insights is the key to expanding your reach, boosting engagement, and establishing yourself as a thought leader on LinkedIn.
What types of posts perform best on LinkedIn?
To get the most out of LinkedIn, prioritize visual and interactive content. Posts featuring videos can drive up to five times more engagement than plain text, making them a powerful tool for catching attention. Similarly, image posts, especially those in multi-image carousel formats, often see higher levels of comments and shares. And don’t overlook polls – they’re a simple yet effective way to double your reach and encourage quick audience participation.
When it comes to written content, keep it short and impactful. Thought-leadership posts that are concise – sticking to sentences under 12 words – tend to perform exceptionally well, generating up to six times more engagement than typical job-related updates. Focus on crafting posts that provide value, spark meaningful discussions, and connect with your audience.
What is the best time to post on LinkedIn to maximize visibility?
The most effective times to post on LinkedIn are generally weekdays during regular business hours. Specifically, Tuesday through Thursday between 10:00 AM and 12:00 PM ET tends to be ideal. These time slots align with when professionals are most active and likely to engage on the platform.
For a more tailored approach, consider using Typoro’s analytics. This tool helps track your audience’s activity, enabling you to pinpoint the best posting times for your unique network. By doing so, your content is more likely to reach the right audience at the right moment.
Related Blog Posts
 Kieran Ball - Founder
"Typoro makes it easier to be a consistent presence on LinkedIn"
The LinkedIn Ghostwriter for Busy Founders.
Typoro’s AI agents think, research and write weekly LinkedIn posts that help grow your personal brand.